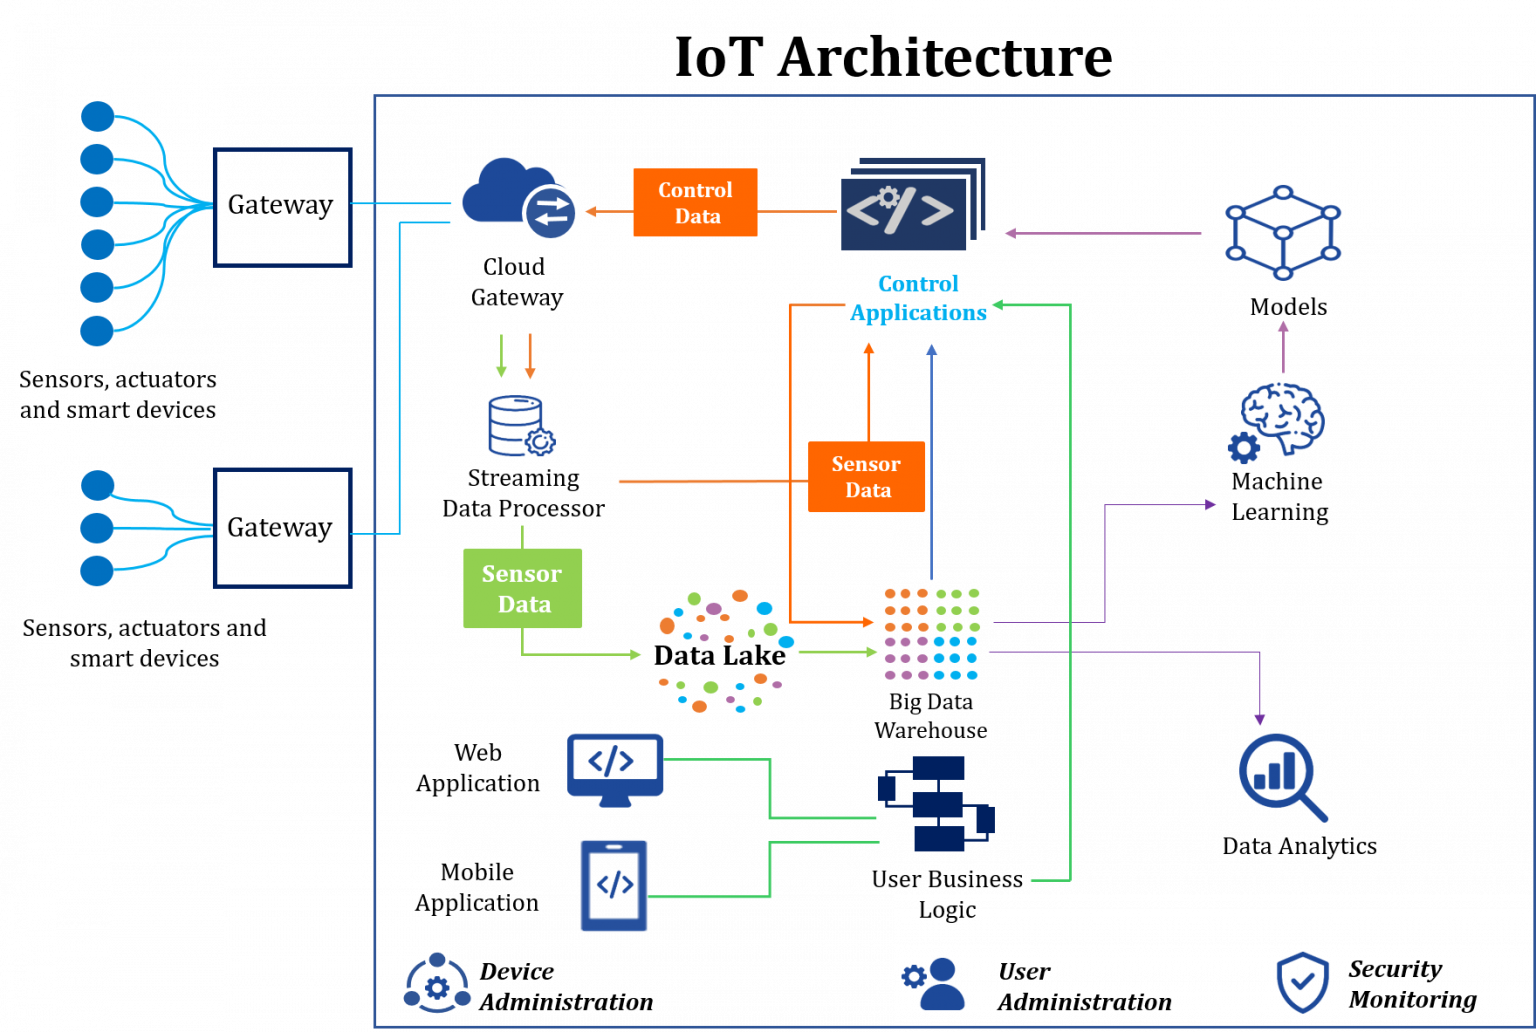
“Internet of things” refers to systems that link and exchange data with other systems and devices over the Internet or other communications networks and have sensors, computing power, software, and other technologies. We are dedicated to harnessing the power of IoT to create a smarter, more connected world.

Discover the full range of IoT solutions we offer to help you connect the physical and digital worlds. We provide end-to-end IoT services to satisfy your unique requirements, ranging from smart devices and sensors to data analytics and cloud integration.
Join our IoT community to connect with other IoT enthusiasts, professionals, and thought leaders. Participate in debates, exchange ideas, and work together on IoT initiatives that promote innovation and advancement.

Data Integration
IoT involves connecting diverse devices and sensors that can generate data in different formats. Data integration is the process of collecting data from various sources, often with varying data structures and protocols, and bringing it together into a unified format. This can involve converting data into a common language or format that can be easily understood by other components of the IoT system.

Data Transmission
IoT devices continuously collect data, and this data needs to be transmitted to central servers or cloud platforms for further processing and analysis. Data transmission involves sending data over communication protocols such as Wi-Fi, cellular networks, Bluetooth, or other wireless technologies. The choice of transmission method depends on factors like data volume, distance, latency requirements, and power constraints.

Data Processing
Once the data is collected, it needs to be processed. Data processing involves cleaning, transforming, and organizing the raw data into a usable form. This might include removing noise, handling missing values, and standardizing units of measurement. Data processing can occur at different stages: within the IoT device itself (edge computing), in a local gateway, or in a centralized cloud environment.

Data Visualization
Data visualization is the process of representing the analyzed data in a visual format that is easy to understand. Dashboards, graphs, charts, and maps are common forms of data visualization. Effective data visualization helps users quickly grasp insights and trends, making it easier for decision-makers to interpret and act upon the information.

Data Analysis and Prediction
After processing, the data is ready for analysis. Data analysis involves applying statistical and machine learning techniques to extract insights, patterns, and trends from the data. Predictive analytics can be used to forecast future events based on historical data. For example, in industrial IoT, predictive maintenance uses data analysis to predict when machinery might fail, allowing for proactive maintenance.